Erik Lehmann · 10 September 2026
Advanced Simulation Software Exposes Coastal Port Weaknesses as Sea Levels and Storms Intensify
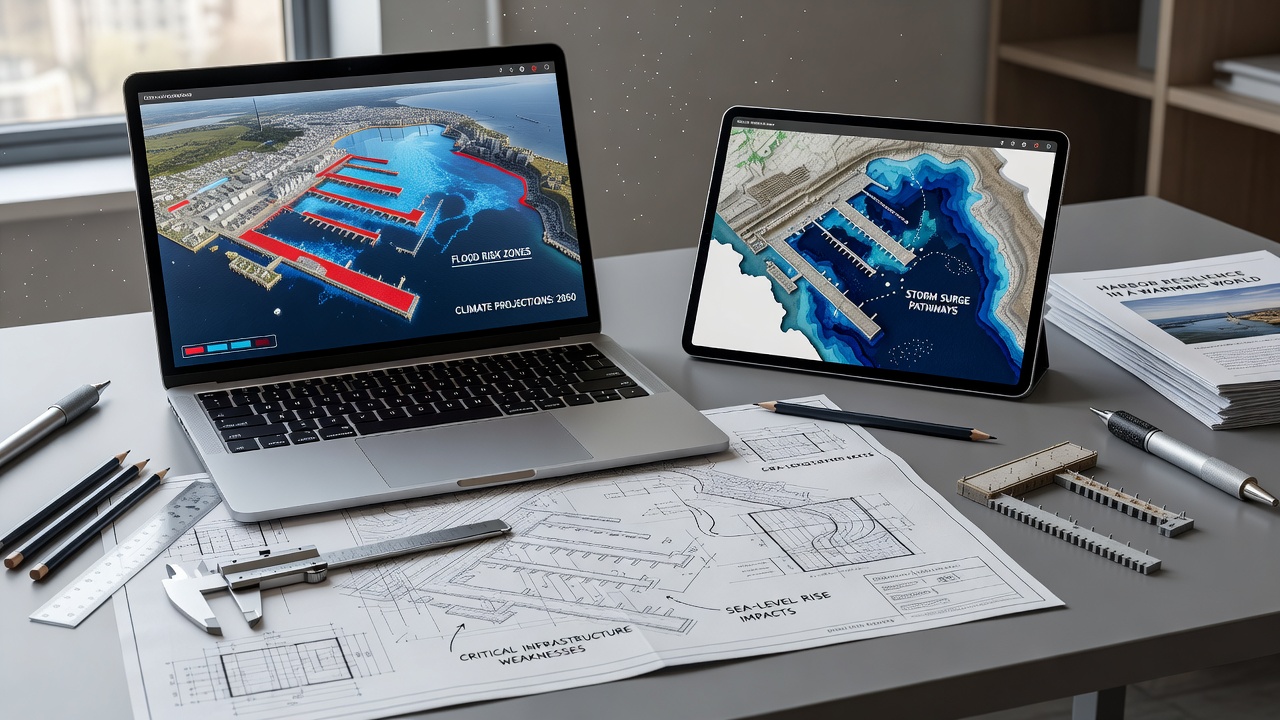
Researchers at several institutions have applied high-resolution hydrodynamic modeling tools to assess how rising sea levels combined with more intense storm activity could affect harbor facilities around the world, and data compiled through these efforts show clear patterns of exposure in low-lying terminals, breakwaters, and access roads. The tools integrate historical tide records, projected greenhouse gas emissions scenarios, and local bathymetry to generate maps that highlight sections of infrastructure likely to experience overtopping or erosion within coming decades, while September 2026 updates from ongoing monitoring programs have refined some of these projections with newly collected sensor readings.
One study coordinated across multiple coastal sites used coupled wave and surge models to simulate events similar to those recorded in past decades but with added sea level increments of 0.3 to 0.6 meters by mid-century, and results indicated that several container yards and fuel storage areas sit below critical thresholds for repeated flooding during king tides amplified by storm surge. Engineers who reviewed the outputs noted that drainage systems designed decades ago now lack capacity under the revised conditions, prompting calls for targeted retrofits rather than wholesale reconstruction in the near term.
How the Modeling Frameworks Operate
Modern tools rely on finite element or finite volume methods that divide harbor geometries into thousands of computational cells, each solving equations for fluid motion, sediment transport, and structural loading at time steps measured in seconds during peak events. Input layers include digital elevation models from LiDAR surveys, wind fields from meteorological reanalysis products, and probabilistic sea level rise curves drawn from global climate ensembles, while validation against gauge data from actual past storms helps confirm the accuracy of predicted inundation extents.
These frameworks allow scenario testing where users adjust parameters such as barrier height or channel depth to observe downstream effects on water levels and flow velocities, and one case involved a European port authority that tested the addition of a movable flood gate system to see whether it reduced peak water levels at key wharves by measurable amounts. Outputs appear as color-coded risk maps and time-series graphs that infrastructure managers can overlay with asset databases to prioritize maintenance schedules.
Observed Patterns Across Different Regions
Ports along the US Atlantic and Gulf coasts show elevated risk profiles in areas where subsidence compounds global sea level trends, whereas facilities in the Pacific Northwest face different challenges tied to wave climate shifts and riverine flooding interactions, according to figures released by the National Oceanic and Atmospheric Administration. In Australia, modeling conducted by the Bureau of Meteorology has identified similar vulnerabilities at several bulk cargo terminals where existing revetments sit close to design limits under combined tide and wave conditions projected for 2050.
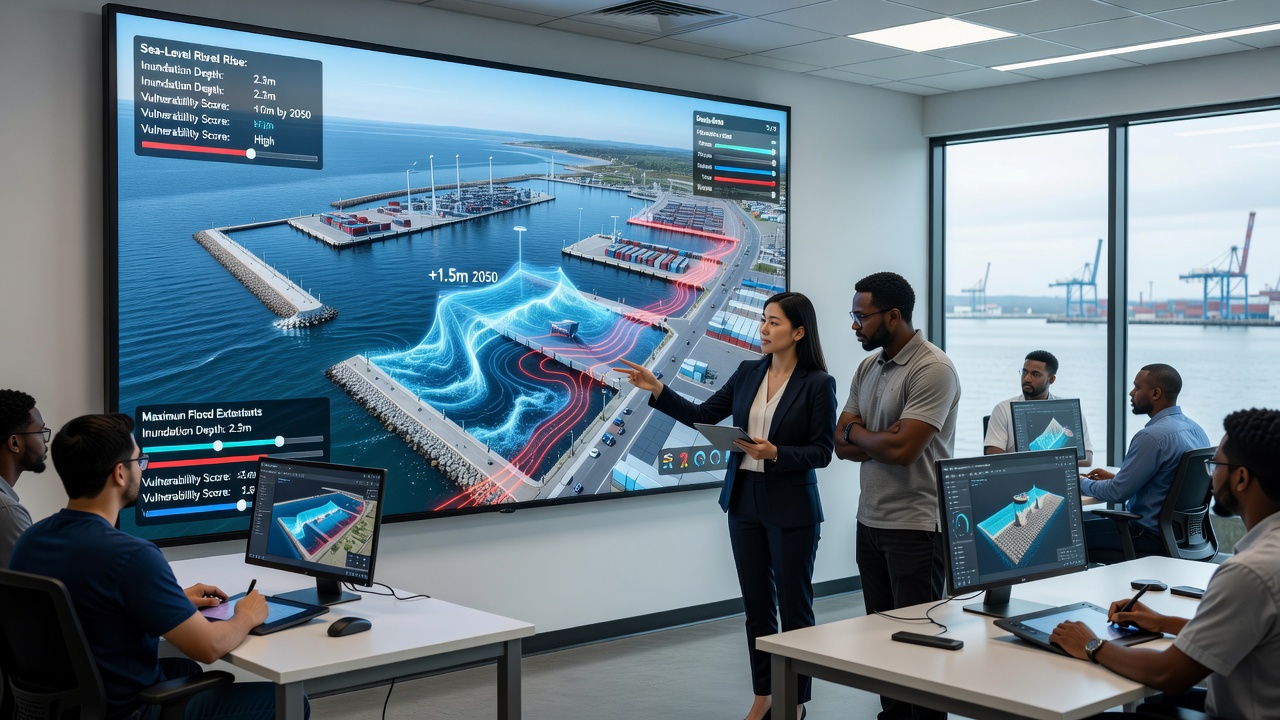
European ports have applied comparable methods through initiatives supported by the European Environment Agency, revealing that many older quays constructed before current climate projections now experience more frequent overtopping during autumn storms. Data from these studies further indicate that sediment movement patterns are changing, which can either protect or expose foundations depending on local current regimes, and planners use this information when evaluating nourishment projects or realignment options.
Integration With Infrastructure Planning
Port authorities have begun incorporating model outputs directly into capital improvement programs, using the visualizations to justify budget allocations for elevated electrical substations and reinforced sheet pile walls, while insurance providers reference the same datasets when calculating premiums for waterfront properties. One collaborative project between academic teams and a Canadian port authority produced a decision-support dashboard that combines real-time tide forecasts with the static vulnerability layers, allowing operators to activate temporary barriers hours before an anticipated event reaches critical thresholds.
Training programs for harbor engineers now include modules on interpreting these simulation results, and professional organizations have developed guidelines that standardize how uncertainty ranges should be communicated to non-technical stakeholders such as city councils and shipping companies. The approach avoids overstatement by presenting ensemble results that show both median projections and the upper tail of possible outcomes under high-emissions pathways.
Limitations and Ongoing Refinements
Even the most detailed models carry uncertainties related to future emissions trajectories, local vertical land motion rates, and the representation of small-scale processes such as wave overtopping on complex structures, and researchers continue to improve resolution through higher-performance computing resources. Field campaigns that deploy additional pressure sensors and drone-based surveys help close some of these gaps, yet gaps remain in regions where long-term observational records are sparse.
Updates scheduled for release after September 2026 are expected to incorporate refined ice-sheet dynamics and better coupling between atmospheric and ocean models, which could shift risk classifications for certain facilities currently ranked in the moderate category. Those adjustments will feed into adaptive management frameworks that allow incremental investments rather than single large expenditures based on early projections.
Conclusion
Modeling tools have supplied harbor operators and regulatory bodies with quantitative evidence of flood exposure under evolving climate conditions, enabling more precise allocation of resources toward protective measures. Continued refinement of these methods alongside expanded monitoring networks will support decisions that balance operational continuity with long-term resilience across diverse geographic settings.